
Anonymised client work | Infection disease
Key Account Management & Network Visibility
How mapping the reality of care networks gave the whole business, not just the field team, a shared view of its key accounts and the customers who matter most.
Infectious disease care rarely fits neatly within one hospital or account. Clinicians, pathologists, nurses and support providers often work across several organisations and locations. A key account might involve physicians based at one hospital, with diagnostics provided by another organisation.
The field team understood these connections because they worked with them every day. They knew who the key people were, how accounts clustered and where influence really sat. But most of that knowledge stayed with individual representatives rather than being captured somewhere the wider business could use.
The CRM recorded each HCP’s primary affiliation based on where they worked the most hours. That was administratively correct, but it didn’t show the full commercial picture. For some HCPs, a second or third location was where their influence on the account was strongest.
Without those relationships captured, marketing, medical, commercial operations and leadership had no consistent view of how key accounts were connected or performing. Meetings were spent piecing together the basics—who the key players were, who influenced who and what was happening—before the team could get to strategy and next steps
The challenge

A simplified view of the account network, showing the relationships the field team understood but the CRM didn’t capture.
We didn’t start with the dashboard. First, we needed to understand how care was actually organised.
That meant researching treatment pathways, reviewing several internal data sources and speaking with field representatives and other stakeholders. Their input helped us build a mapping algorithm that went beyond the primary affiliation recorded in the CRM. It captured secondary and tertiary locations, as well as the relationships between HCPs and accounts.
Once those connections were mapped, field activity—visits, emails and events—could be assigned to the account it actually related to, rather than automatically rolling up to an HCP’s primary affiliation. This revealed engagement that had previously been hidden or attributed to the wrong place.
The mapping was designed to be repeatable, rather than a one-off clean-up. As new HCPs were added or affiliations changed, the network could be updated without starting again.
The dashboard then brought the mapped network and account performance together, giving commercial, medical, marketing and operations teams a shared view for the first time.
The work
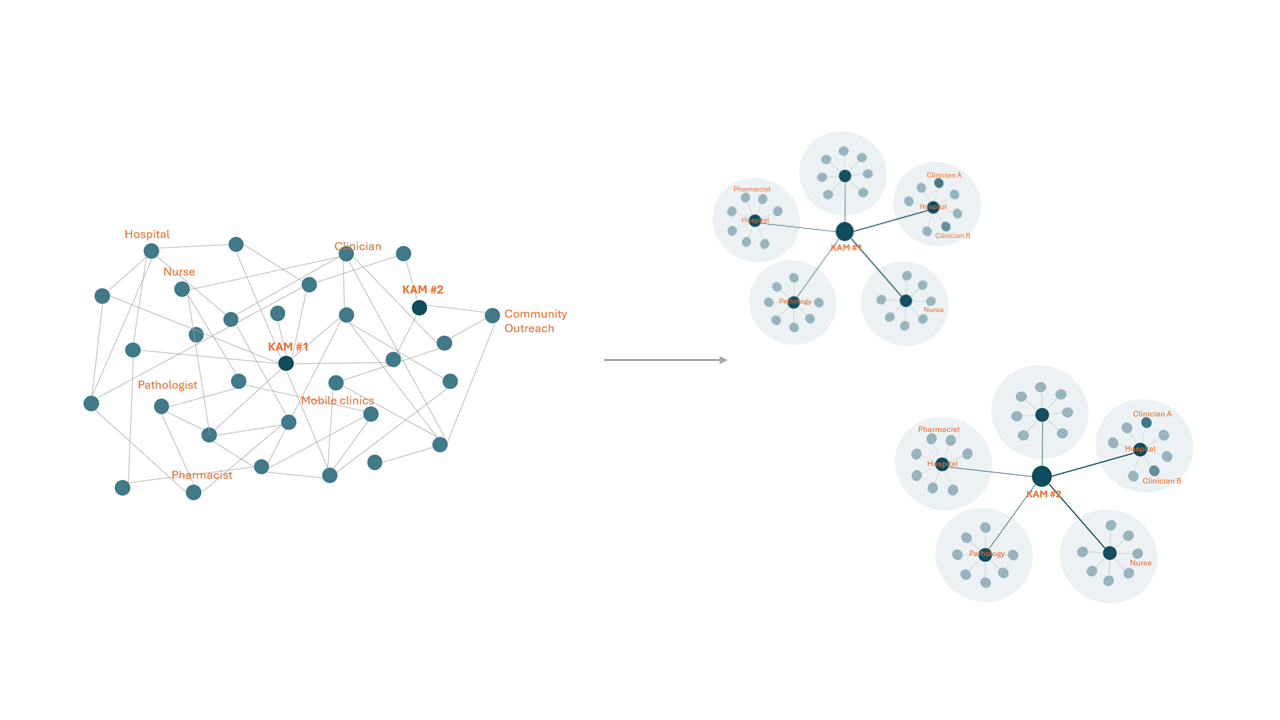
Once the relationships were mapped, the team could see which HCPs were connected to each key account and where their influence sat.
The dashboard changed both the preparation and the conversation. The team spent far less time bringing information together and more time discussing what was happening in each account, where attention was needed and what to do next.
The result
Operational
Monthly business-review preparation reduced from several days to under an hour.

Strategic
Underperforming accounts and coverage gaps became visible, enabling clearer prioritisation and more focused engagement.

People
Field knowledge was captured in one shared view, reducing reliance on individuals and helping new starters get up to speed faster.
“ This tool gives us real insight into our business performance and helps us focus on where we can improve.”
Business Unit Director
Facing something similar?
If your team’s picture of its key accounts lives in people’s heads, and meetings start with getting everyone on the same page, let's talk.